I recently made a post on Reddit showcasing my Grafana dashboard. I wasn’t expecting it to really get any clicks, but as a labor of love I thought I’d spark the interest of a few people. I got a significant amount of feedback requesting that I make a blog post to show how I setup the individual parts to make my Grafana dashboard sparkle.
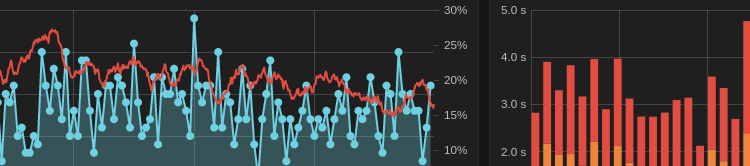
Let’s start with the basics. What the heck is Grafana? Well this image should give you an idea of what you could be able to make, or make better with Grafana.

I use this single page to graph all my the statistics I care about glancing at in a moment’s notice. It allows me to see a quick overview of how my server is doing without having to access five or six different hosts to see where things are at. Furthermore, it graphs these over time, so you can quickly see how your resources are managing the workload you have on the server at any given point. So if you’re sold – let’s get started! There is a lot to cover, so I’ll start with laying out the basics to help new users understand how it all ties together.
Let’s start with terminology and applications that will be used in this tutorial.
- Grafana – The front end used to graph data from a database. What you see in the image above, and by far the most fun part of the whole setup.
- Grafite – A backend database supported by Grafana. It has a lot of neat custom features that make it an attractive option for handling all of the incoming data.
- InfluxDB – Another backend database supported by Grafana. I prefer this database for speed to implement, my own prior knowledge, and as a byproduct of a few tutorials I dug up online. This tutorial will be showing you how to setup services using InfluxDB, however I’m sure that Grafite would work equally as well if you want to color outside of the box.
- SNMP – Simple Network Management Protocol. I use this protocol as a standard query tool that most network devices natively support, or can have support added. SNMP uses OIDs to query data, but don’t worry, you don’t have to have any special addons if you don’t want them. I recommend you look up the specific SNMP datasheet for your device, as some devices have custom OIDs that give you very interesting graphable information! I’ll explain this more later.
- IPMI – Intelligent Platform Management Interface. This is used to pull CPU temperatures and fan speeds from my Supermicro motherboard. Most server grade motherboards have a management port with SNMP support. Look it up, you’ll be surprised the information you can get!
- Telegraf – During the course of this article you’ll see that I use a lot of custom scripts to get SNMP/IPMI data. Another option would be to use Telegraf. I eventually will move most of my polling to Telegraf, but for right now I’m using Telegraf purely for docker statistics. I’ll explain how to set it up here.
- Collectd – CollectD is an old popular favorite. It’s an agent that runs on the baremetal server or in a VM that will automatically write data into your InfluxDB database. Very cool – but I don’t use it, because I prefer to limit installing extra tools on every server to monitor them.
I’ll walk you through how I setup the following monitoring applications:
- ESXi CPU and RAM Monitoring via SNMP and a custom script for RAM
- Supermicro IPMI for temperature and fan speed monitoring
- Sophos SNMP for traffic load monitoring
- UPS/Load monitoring with custom scripts and SNMP through a Synology NAS and CyberPower Panel
- Docker Statistics for CPU and RAM monitoring via Telegraf
- Synology Temperature and Storage information using SNMP
- Plex Current Transcodes using a simple PHP script