Make my freezer smarter (Part 2)! Now featuring the ESP8266 :D

If you read my previous post, I’ve been on a journey to make my freezer smarter. As it turns out, freezing a SmartThings ZigBee Multisensor tends to destroy CR2450 batteries. I’m sure that, coupled with the continuous temperature rise and drop contributed to this solution not working for me.

After doing EXTENSIVE searching for the “right” solution, I found a few battery powered options.  I wanted something hardwired to power, with a waterproof temperature sensor.  To my surprise, this product category did not exist.  So I set out to make my own solution.

My goal here is to show you everything you need to know about making a ESP8266 Wi-Fi node that communicates via MQTT and/or directly publishes to a SmartThings HUB.  I’ll share the hardware, schematics, code, and some pictures of the finished product.

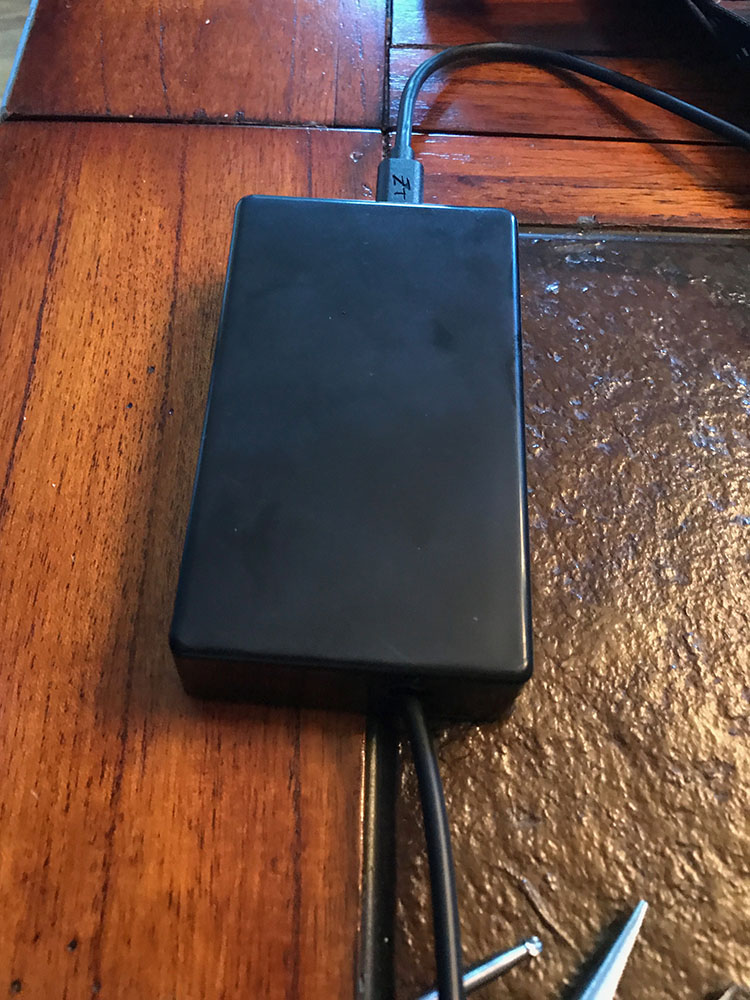
Here are a couple of pictures of the finished product. If this interests you, read more after the break.


Continue reading…!

Shopping!

Time to go shopping!  I know I wanted to try out an ESP8266 after seeing the multitude of cool projects done with it.  Plus the development kit is only $8-9 USD.  Why not?

Shopping List:

Total Cost: $78.29

Now, there are a lot of parts on the list above you might already have, or might find in lower quantities. I actually wanted some extra of everything for upcoming projects (Stay tuned!). BOM cost for this project will be around $21.65. That isn’t too bad IMHO.

Other stuff (if you don’t already have these), just to make life easier:

Total Cost: $89.81

You may also want some standard electronics equipment like a multimeter, pliers, ESD protection, oscilloscope, etc. These aren’t totally required for this project.

Schematics

This is going to be pretty easy.  The ESP8266 is doing all of the heavy lifting for this project.  Having the development kit takes care of DC voltage regulation, USB serial, WiFi, and the code space to make it do your bidding.  All we need to do is wire up the DS18B20.

The DS18B20 is a 3 wire interface.

  • Red is your supply voltage (VDD) from 3.0V to 5.0V.  For this, we are going to take power from the ESP8266 off one of the 3.3V voltage pins.
  • Black is your ground (GND).  For this, we are going to take ground from the ESP8266 off one of the GND pins.
  • Yellow is your 1-Wire serial interface (DQ) for communicating with the sensor.  For this, we are going to wire this to one of the GPIO’s on the board.

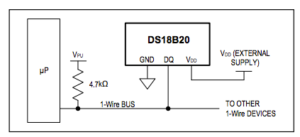
Wiring up this sensor is pretty straight forward, but there is one thing you will need to do to ensure proper communications over the 1-wire serial interface.  You will need to make sure you install a pull-up resistor (4.7kΩ) on the 1-wire serial interface (Yellow) above as shown in this diagram from the datasheet.  Here is a schematic of how this looks.

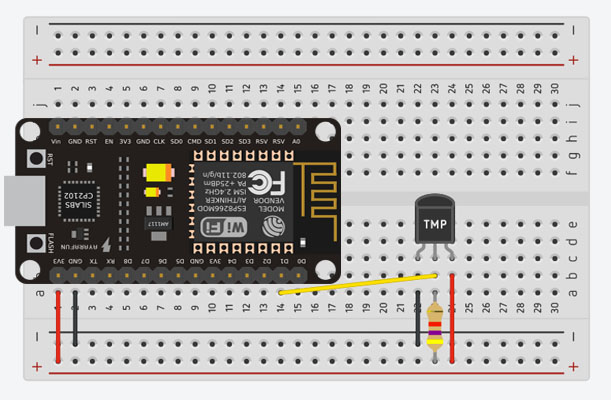
For this example, here is a snapshot of our planned schematic.

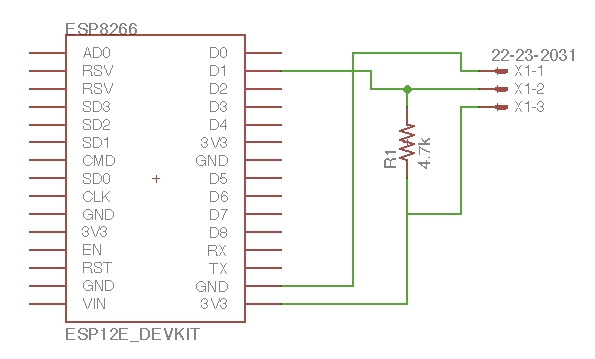
And here is how it will look on our breadboard

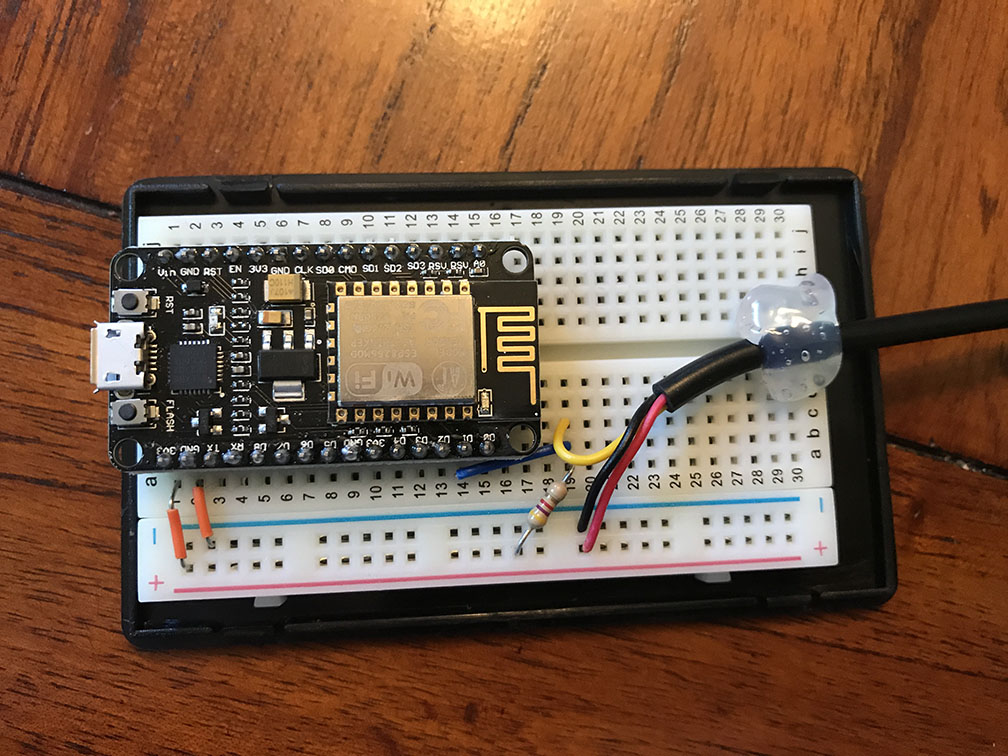
Time for some real work!

Now it’s time to wire this guy up.  Here are some photos of the project.  (Note: This project can easily be done sans breadboard by soldering directly to the pins on top of the board.  I chose to use a breadboard mostly because I had the space in my box.  Your choice here on what path you want to take!)

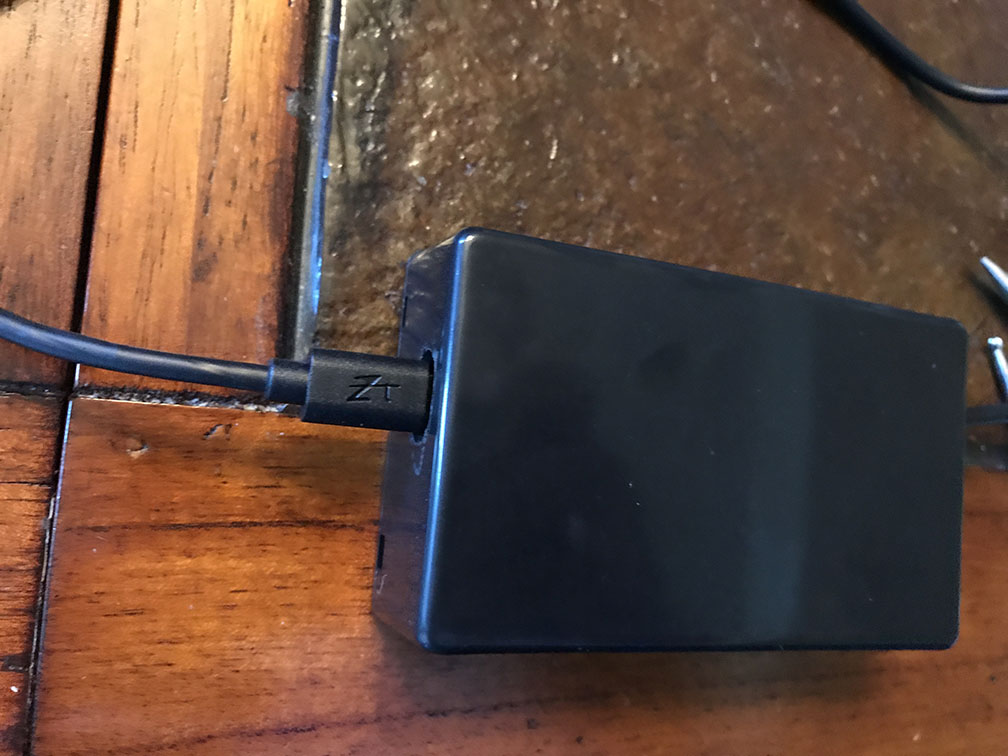
Some “Next Level” Dremel work here…

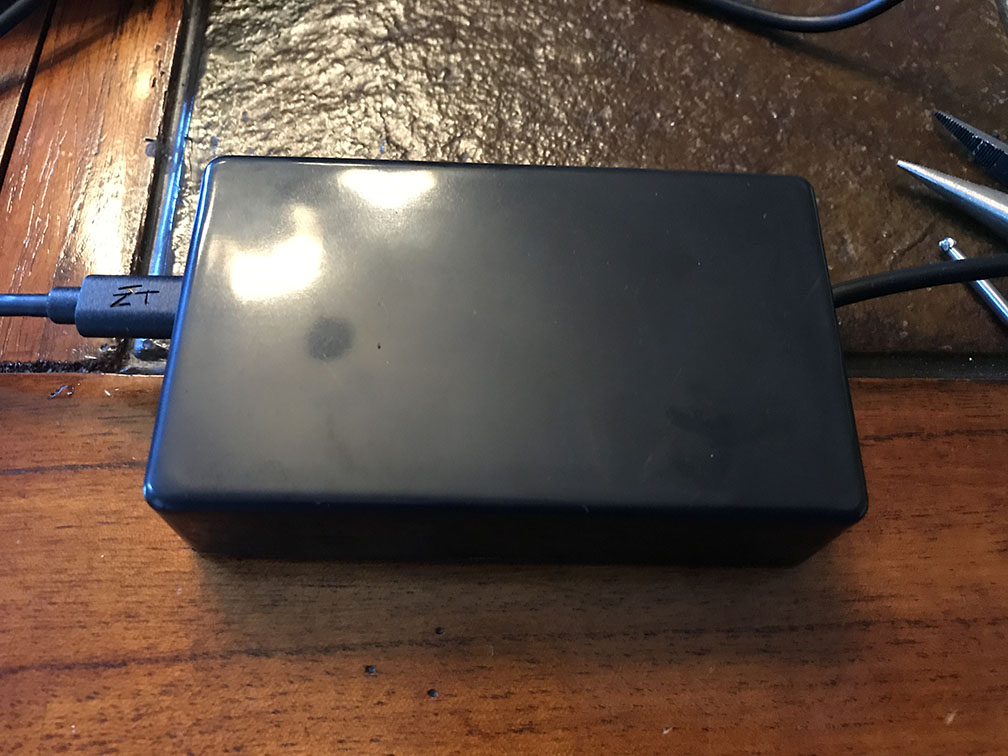
Annndd.. A glamor shot

Let’s write some code! [Coming Soon]

I recommend taking the device out of the box before starting this.  Getting to see the LED status is very handy as you start downloading code and testing.

[Will post the code once I get it up on my git repo.]

The easy way to pull UPS statistics using CyberPower Panel

Since setting up my Grafana panel, one thing that has been bugging me is that I had to modify the “vanilla” Cyberpower Panel software with pwrstat to pull the statistics I wanted. Not only was I concerned with conflicts with the actual shutdown software, but I didn’t want to introduce a forced post-process after upgrading the panel in the future. A redditor recommended that I check out init_status.js on the Cyber Power Panel, to see if I could potentially pull data from there instead of from pwrstat as my previous script had been doing.

http://<your CPP IP>:3052/agent/ppbe.js/init_status.js

You get an output like this

var ppbeJsObj={"status":{"communicationAvaiable":true,"onlyPhaseArch":false,"utility":{"state":"Normal","stateWarning":false,"voltage":"122.0","frequency":null,"voltages":null,"currents":null,"frequencies":null,"powerFactors":null},"bypass":{"state":"Normal","stateWarning":false,"voltage":null,"current":null,"frequency":null,"voltages":null,"currents":null,"frequencies":null,"powerFactors":null},"output":{"state":"Normal","stateWarning":false,"voltage":"122.0","frequency":null,"load":10,"watt":90,"current":null,"outputLoadWarning":false,"outlet1":null,"outlet2":null,"activePower":null,"apparentPower":null,"reactivePower":null,"voltages":null,"currents":null,"frequencies":null,"powerFactors":null,"loads":null,"activePowers":null,"apparentPowers":null,"reactivePowers":null,"emergencyOff":null,"batteryExhausted":null},"battery":{"state":"Normal, Fully Charged","stateWarning":false,"voltage":"24.0","capacity":100,"runtimeFormat":0,"runtimeFormatWarning":false,"runtimeHour":1,"runtimeMinute":1,"chargetimeFormat":null,"chargetimeHour":null,"chargetimeMinute":null,"temperatureCelsius":null,"highVoltage":null,"lowVoltage":null,"highCurrent":null,"lowCurrent":null},"upsSystem":{"state":"Normal","stateWarning":false,"temperatureCelsius":null,"temperatureFahrenheit":null,"maintenanceBreak":null,"systemFaultDueBypass":null,"systemFaultDueBypassFan":null},"modules":null,"deviceId":1}};

Well look at that! There’s pretty much everything I ever wanted, in a completely open format that does not require ANY login. Guess it’s time to dust off vi and get to bashing this. One COULD go the route of installing a JSON parser, but if you look closely, the output isn’t exactly perfect JSON. Either way, why institute the overhead when you could simply grep what you want. So without further ado, here’s how I did just that.

First you want to pull the status page into a variable

cpp_json_data=$(curl http://<your CPP IP>:3052/agent/ppbe.js/init_status.js)

Then you’ll want to parse what you want with grep like this:

#input voltage
cpp_involts=$(echo $cpp_json_data |\
 grep -oP '(?<="voltage":")[^."]*' | head -1)

#battery voltage
cpp_battvolts=$(echo $cpp_json_data |\
 grep -oP '(?<="voltage":")[^."]*' | tail -1)

#Load(Watts)
cpp_loadwatt=$(echo $cpp_json_data |\
 grep -oP '(?<="watt":)[^,]*' | head -1)

#Capacity %
cpp_capacity=$(echo $cpp_json_data |\
 grep -oP '(?<="capacity":)[^,]*' | head -1)

#Runtime
runtimeHour=$(echo $cpp_json_data |\
 grep -oP '(?<="runtimeHour":)[^,]*' | head -1)
runtimeMinute=$(echo $cpp_json_data |\
 grep -oP '(?<="runtimeMinute":)[^,]*' | head -1)
cpp_runtime=$(($runtimeHour*60*60+$runtimeMinute*60))

#Load %
cpp_loadpercent=$(echo $cpp_json_data |\
 grep -oP '(?<="load":)[^,]*' | head -1)

What you see here, is that we request the CPP page with the “JSON”-like data. The rest of the commands are simply parsing that data to pull out the numbers I wanted to plug into my influxdb. This turned out to be infinitely easier than doing it the other method, and easy to maintain going forward. I’ve since updated my upsmon.sh script to incorporate this function, which competely eliminates the need to have the cpupssmon.sh script I previously had running on the CPP instance.

Note: As with my other scripts, you’ll need to use a version of grep that supports regular expressions (the -P flag). The default in Ubuntu supports this. OSX does not, but a simple brew will get you the grep you’re looking for :). Alternatively you could use awk, or perl if you are fancy!

There you have it, a completely transparent modification

grafana_power

Here is the new upsmon.sh script
Here are the changes made to upsmon.sh

Let me know what you think, or if you have any suggestions for improvement! Happy labbin.

Setup a wicked Grafana Dashboard to monitor practically anything

I recently made a post on Reddit showcasing my Grafana dashboard. I wasn’t expecting it to really get any clicks, but as a labor of love I thought I’d spark the interest of a few people. I got a significant amount of feedback requesting that I make a blog post to show how I setup the individual parts to make my Grafana dashboard sparkle.

Let’s start with the basics.  What the heck is Grafana?  Well this image should give you an idea of what you could be able to make, or make better with Grafana.

grafdashboard

I use this single page to graph all my the statistics I care about glancing at in a moment’s notice.  It allows me to see a quick overview of how my server is doing without having to access five or six different hosts to see where things are at.  Furthermore, it graphs these over time, so you can quickly see how your resources are managing the workload you have on the server at any given point.  So if you’re sold – let’s get started!  There is a lot to cover, so I’ll start with laying out the basics to help new users understand how it all ties together.

Let’s start with terminology and applications that will be used in this tutorial.

  • Grafana – The front end used to graph data from a database. What you see in the image above, and by far the most fun part of the whole setup.
  • Grafite – A backend database supported by Grafana. It has a lot of neat custom features that make it an attractive option for handling all of the incoming data.
  • InfluxDB – Another backend database supported by Grafana. I prefer this database for speed to implement, my own prior knowledge, and as a byproduct of a few tutorials I dug up online. This tutorial will be showing you how to setup services using InfluxDB, however I’m sure that Grafite would work equally as well if you want to color outside of the box.
  • SNMP – Simple Network Management Protocol. I use this protocol as a standard query tool that most network devices natively support, or can have support added. SNMP uses OIDs to query data, but don’t worry, you don’t have to have any special addons if you don’t want them. I recommend you look up the specific SNMP datasheet for your device, as some devices have custom OIDs that give you very interesting graphable information! I’ll explain this more later.
  • IPMI – Intelligent Platform Management Interface. This is used to pull CPU temperatures and fan speeds from my Supermicro motherboard. Most server grade motherboards have a management port with SNMP support. Look it up, you’ll be surprised the information you can get!
  • Telegraf – During the course of this article you’ll see that I use a lot of custom scripts to get SNMP/IPMI data. Another option would be to use Telegraf. I eventually will move most of my polling to Telegraf, but for right now I’m using Telegraf purely for docker statistics. I’ll explain how to set it up here.
  • Collectd – CollectD is an old popular favorite. It’s an agent that runs on the baremetal server or in a VM that will automatically write data into your InfluxDB database. Very cool – but I don’t use it, because I prefer to limit installing extra tools on every server to monitor them.

I’ll walk you through how I setup the following monitoring applications:

  • ESXi CPU and RAM Monitoring via SNMP and a custom script for RAM
  • Supermicro IPMI for temperature and fan speed monitoring
  • Sophos SNMP for traffic load monitoring
  • UPS/Load monitoring with custom scripts and SNMP through a Synology NAS and CyberPower Panel
  • Docker Statistics for CPU and RAM monitoring via Telegraf
  • Synology Temperature and Storage information using SNMP
  • Plex Current Transcodes using a simple PHP script

Read More…
Read More

Setting up a Dockerized GitLab at Home

There are few things I love more than git. It’s part of my daily workflow, and I’m not even a developer by profession (any more). I frequently will git init folders just to have history, and to transfer things between servers. One thing I do often is create git repositories in my configuration folders on my servers so I can see what I changed, and roll back in case I royally mucked something up.

This isn’t a git primer, instead I want to share how I setup an instance of Gitlab on my DMZ docker that’s hosting a few external services for me. Compared to the vanilla installation guide, this is MILES easier to load via a docker. What does it give you? Well, future upgrades are easy, the whole database, configuration, and history is in a convenient and easy to backup folder structure, and finally the ability to move this server around as needed.

To get started, this tutorial assumes a few things.

  1. You have an Ubuntu linux server with docker installed.
  2. You’re already familiar with the basics of docker (this isn’t a tutorial for that either).
  3. You have a basic understanding of linux operations, moving files around, and what these commands mean.
  4. Your docker server/VM has 2 CPU cores and 2GB of RAM available.

So let’s get started!

Read More…

Read More